Why Siloed Monitoring Hit the Wall
“The data between the data…is what turns noise into signal.”
The Status Quo
If you run a cloud application, you’ve probably built up the canonical observability data stack — sometimes called LTM (logs, traces, metrics) or MELT (metrics, events, logs, traces), with a bunch of analytics on top. Sometimes these tools come from the same vendor, and sometimes they don’t — but either way, your incident workflow looks the same.
First, you get an alert notification, maybe even a cluster of them. You quickly check a few metric dashboards to get a sense of where unusual behavior might be happening, dive into logs and traces and events to get more detail, send charts and data snippets back and forth over Slack with your co-workers, and try to figure out what’s happening, why, and how to resolve it — usually going through more than a few rounds of trial-and-error. This is what we all do, right? We navigate the data silos by hand, looking at potential causes, looking at a bunch of effects, and then looking at the potential links between them, relying on hard-won system knowledge and lots of manual investigation to fill in the blanks.
But at some point over the last few years, siloed monitoring hit the wall — hard.
What Happened?
As the number of nodes and services and deploys grew, every single part of this process got worse. It took longer to find the right dashboards and interpret increasingly complex metric charts. It took more effort to figure out all the changes that had been made to the application and which ones might be relevant to the issue, trying to get situational awareness across fragmented logs and Slack conversations. It became more difficult to coordinate attempted fixes without stomping on each other. And most of all, it required much more senior engineers to understand how cause and effect might be related inside the application, and thus where and how to start looking.
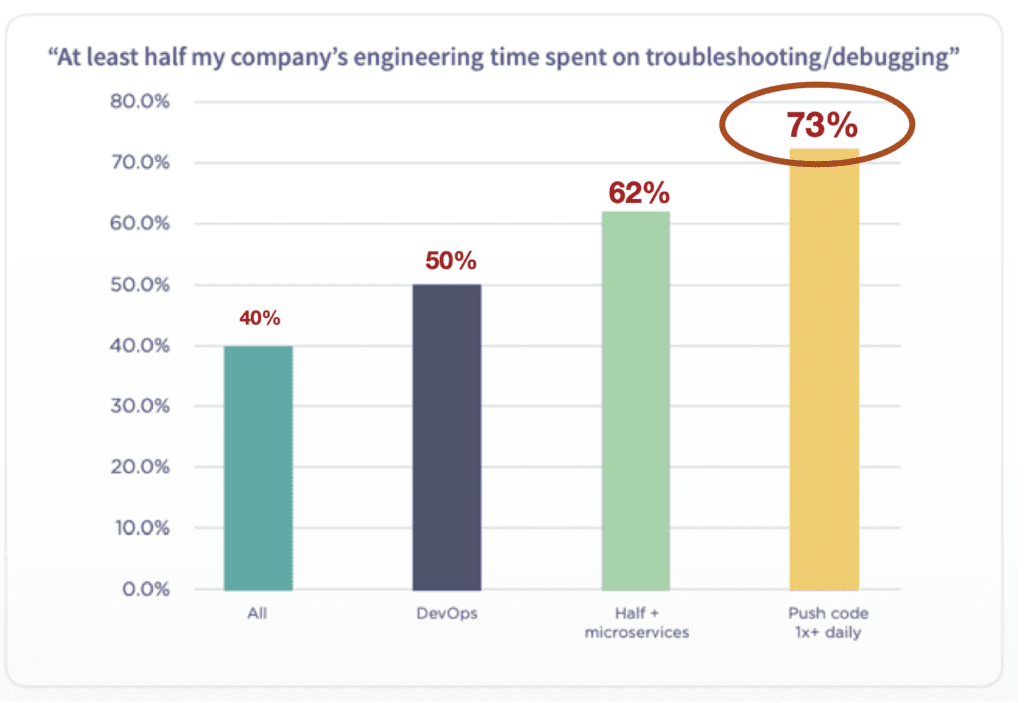
This isn’t just anecdata. It’s widespread across our industry. As a recent survey by Scalyr found, the “troubleshooting tax” — how much time each engineer spends troubleshooting — gets higher as you move to more complex service-based architectures, implement DevOps, and increase deployment frequency. In fact, most companies that deploy daily report that their engineers spend at least half of their time troubleshooting/debugging.
If we were analyzing clinical trials in medicine, we’d call this pattern “dose-dependent” — the more complex/dynamic our architecture and process, the more time we have to spend managing that complexity and dynamism. The underlying question is: why?
Why Siloed Monitoring Didn’t Scale
If you distill an incident down to the fundamentals, what we’re really doing is starting with a set of effects (symptoms) and trying to figure out a set of causes. We need to understand how the system got to the degraded state — and how we can get back to a normal state as quickly as possible, which requires forecasting how our actions (new causes) might lead to potential effects; in other words, it’s a two way game. And more complex/dynamic architectures means more moving parts — which means inflating the number on both sides of the cause/effect equation, and an explosion in their potential links:
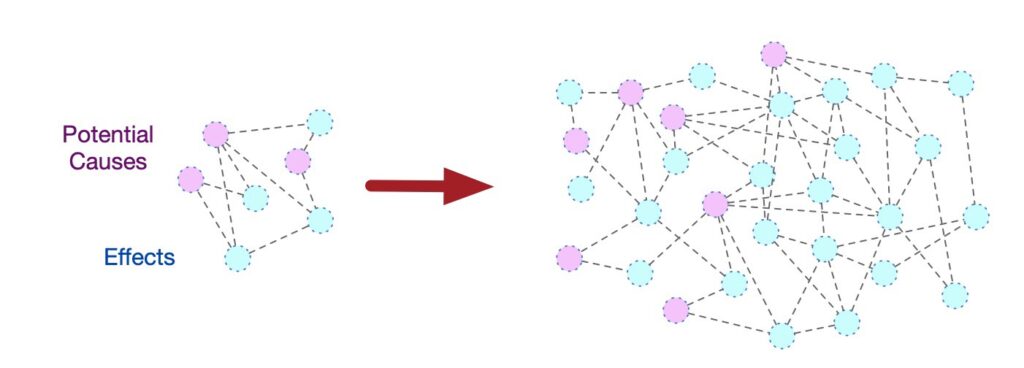
This is why siloed monitoring hit the wall. There had to be something linking together the siloes, and it turned out that we were the links — and we just don’t scale like software does. Our domain knowledge, our eyeballing charts for correlations, our asking around about changes that were made — these manual processes were fine for more simple/static systems, but no longer. We’re not limited by the ingestion rates of our operational data stores but by learning and understanding and applying and acting on the connections between the different data sources that we’re looking at. Siloed monitoring hit the wall because we hit the wall.
The connection between the raw data points — the data between the data — is what turns noise into signal. The raw data points are like individual puzzle pieces left disorganized on a table — if you forced yourself to, you could memorize the puzzle over time to make sense of the pieces. But the puzzle of monitoring data isn’t just disconnected but dynamic — the puzzle is always changing and growing as the application grows and changes. And the more it changes, the more cognitive load your engineers need to take on — until they’re spending half their time troubleshooting.
This is simply not sustainable.
The Future
What could a way forward look like? For starters, it would have to connect the data silos together from the start. It would have to unify the change management schema across a variety of actions. And it would have to explicitly model the links between cause and effect, the same way that we do, where every path in that graph represents a potential hypothesis that could be tested quickly by automation, not eyeballs.
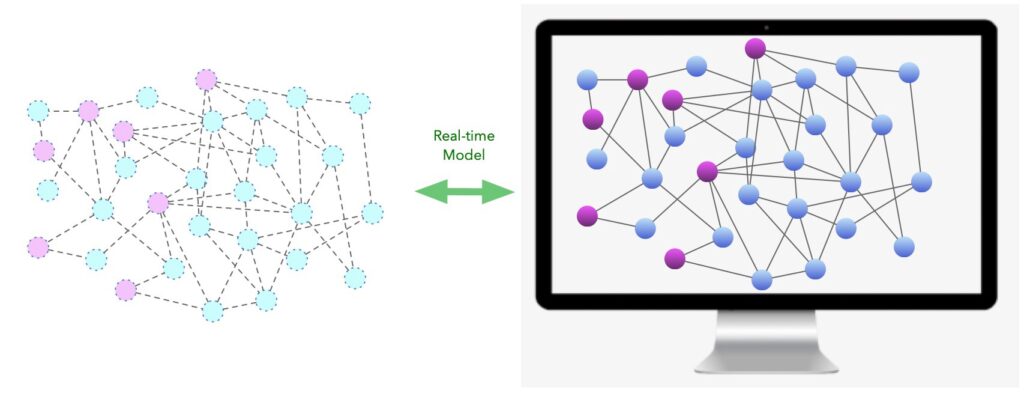
A platform like this would be able to replicate the manual processes, but faster and more accurately. Rather than frantically combing through AWS event logs and application logs and last-minute Slack callouts, users would have a single place to see all the causes in their system and let code rip through the possibilities for a given symptom. And understanding the links between cause and effect would be instantly accessible for all engineers, not just the wizened veterans on your team.
And what would this mean for team outcomes? Well, it would drive teams to faster, better diagnoses and safer investigations. It would allow less experienced engineers to take on more difficult incidents without as much oversight from senior engineers. It would shrink the mean-time-to-resolution. And in the end, it would lower that “troubleshooting tax” on all engineers. Stay tuned.
If you’re dealing with data silos, let us know how we can help make troubleshooting cloud apps easier for you – drop us a line.